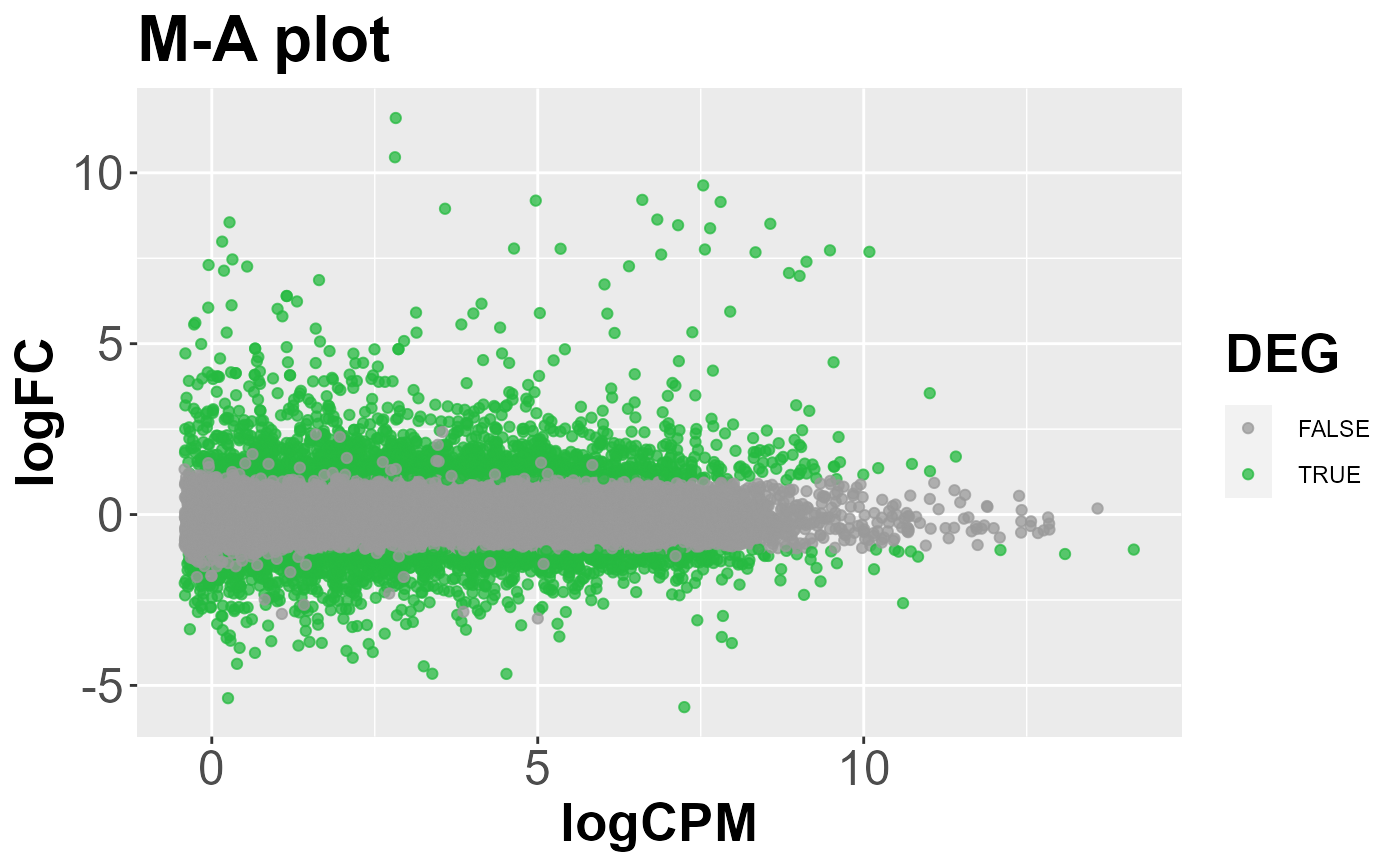
MA or volcano plot for differential expression results
draw_DEGs(tags, fdr = 0.01, lfc = 0, MA = TRUE)
Arguments
| tags | tags returned bu estimateDEGs, function, that is to say topTags from edgeR,
used with |
|---|---|
| fdr | pvalue for DEGs detection |
| lfc | absolute log fold change threshold for differentially expressed genes, default is 0. |
| MA | TRUE : MA plot (LogFC depending on average log expression), or else "Volcano" for FDR depending on logFC. |
Examples
data("abiotic_stresses") tcc_object <- DIANE::normalize(abiotic_stresses$raw_counts, abiotic_stresses$conditions, iteration = FALSE) tcc_object <- DIANE::filter_low_counts(tcc_object, 10*length(abiotic_stresses$conditions)) fit <- DIANE::estimateDispersion(tcc = tcc_object, conditions = abiotic_stresses$conditions)#> Warning: norm factors don't multiply to 1tags <- DIANE::estimateDEGs(fit, reference = "C", perturbation = "H", p.value = 1) DIANE::draw_DEGs(tags, fdr = 0.01, lfc = 1)