Displays clustering results and quality
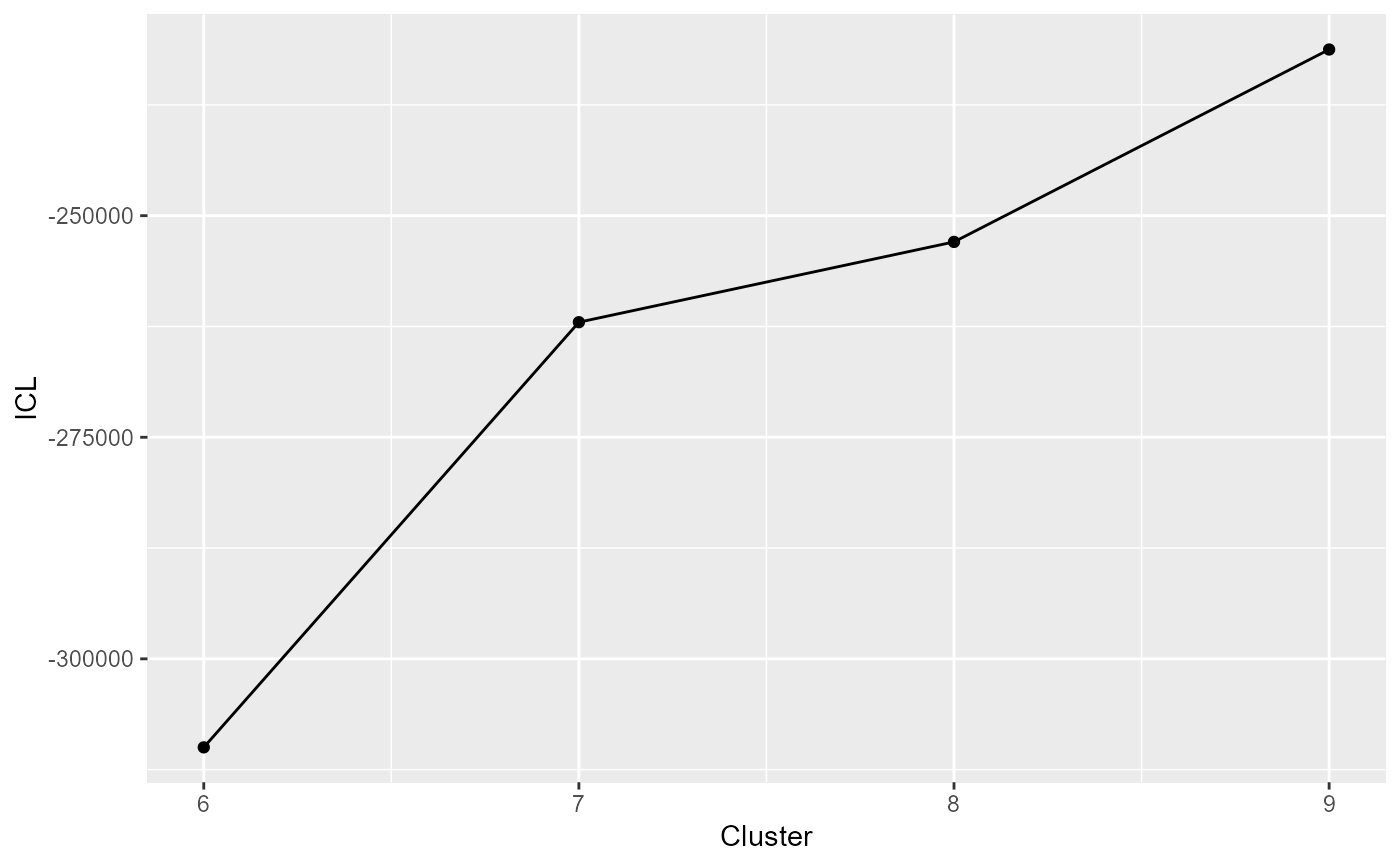
draw_coseq_run(clustering_run, plot = "ICL")
Arguments
| clustering_run | result of a coseq run |
|---|---|
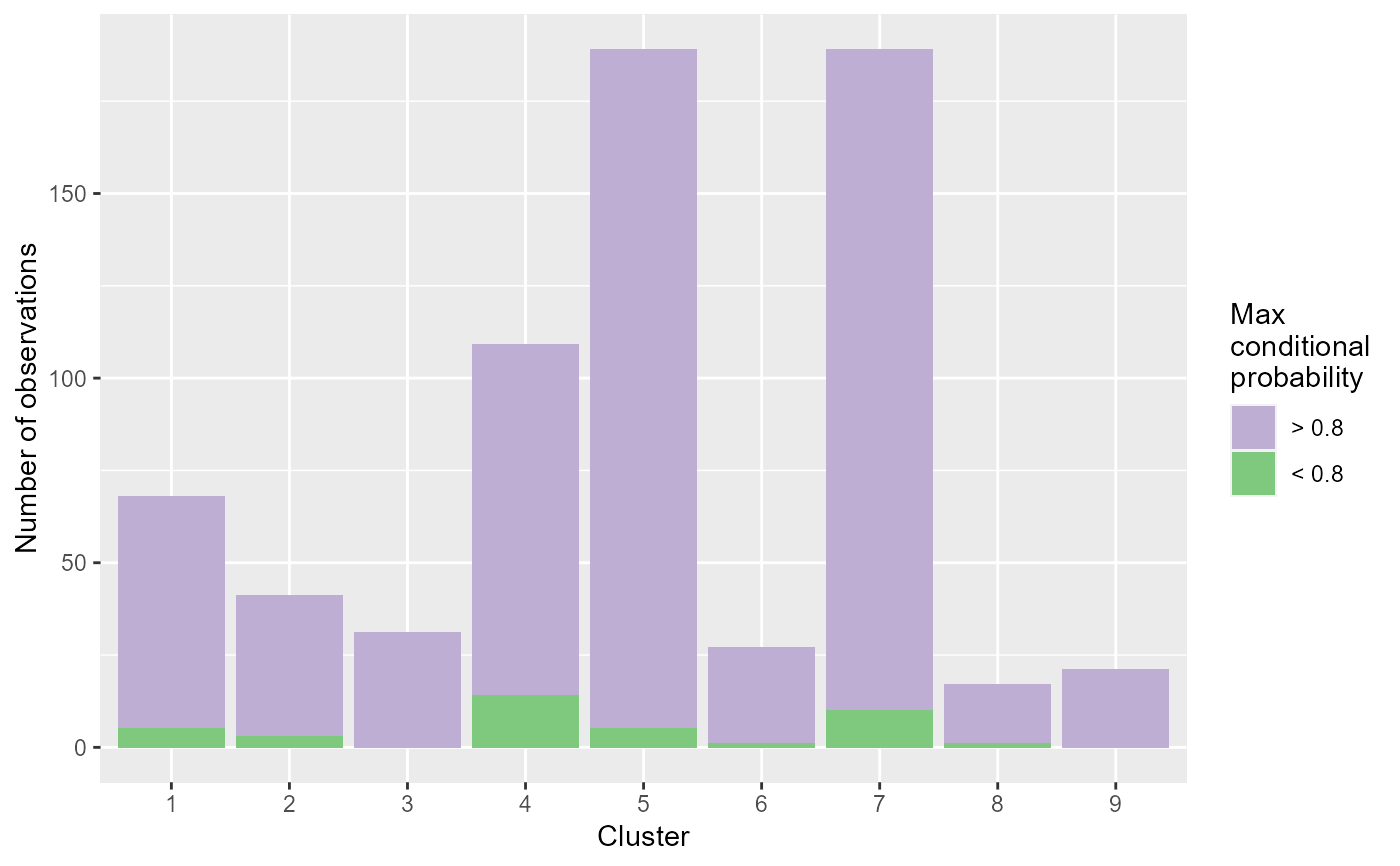
| plot | plot to display, either Integrated Complete Likelihood, or barplots of the posterior probabilities for the clustering. Value must be "ICL" or "barplots". |
Value
plot describing the quality of the clustering process
Examples
data("abiotic_stresses") genes <- abiotic_stresses$heat_DEGs clustering <- DIANE::run_coseq(conds = c("C", "H", "SH", "MH", "SMH"), data = abiotic_stresses$normalized_counts, genes = genes, K = 6:9)#> **************************************** #> coseq analysis: Poisson approach & none transformation #> K = 6 to 9 #> Use seed argument in coseq for reproducible results. #> **************************************** #> Running g = 6 ... #> Running g = 7 ... #> Running g = 8 ... #> Running g = 9 ...DIANE::draw_coseq_run(clustering$model, plot = "barplots")#> $probapost_barplots#>DIANE::draw_coseq_run(clustering$model, plot = "ICL")#> $ICL#>