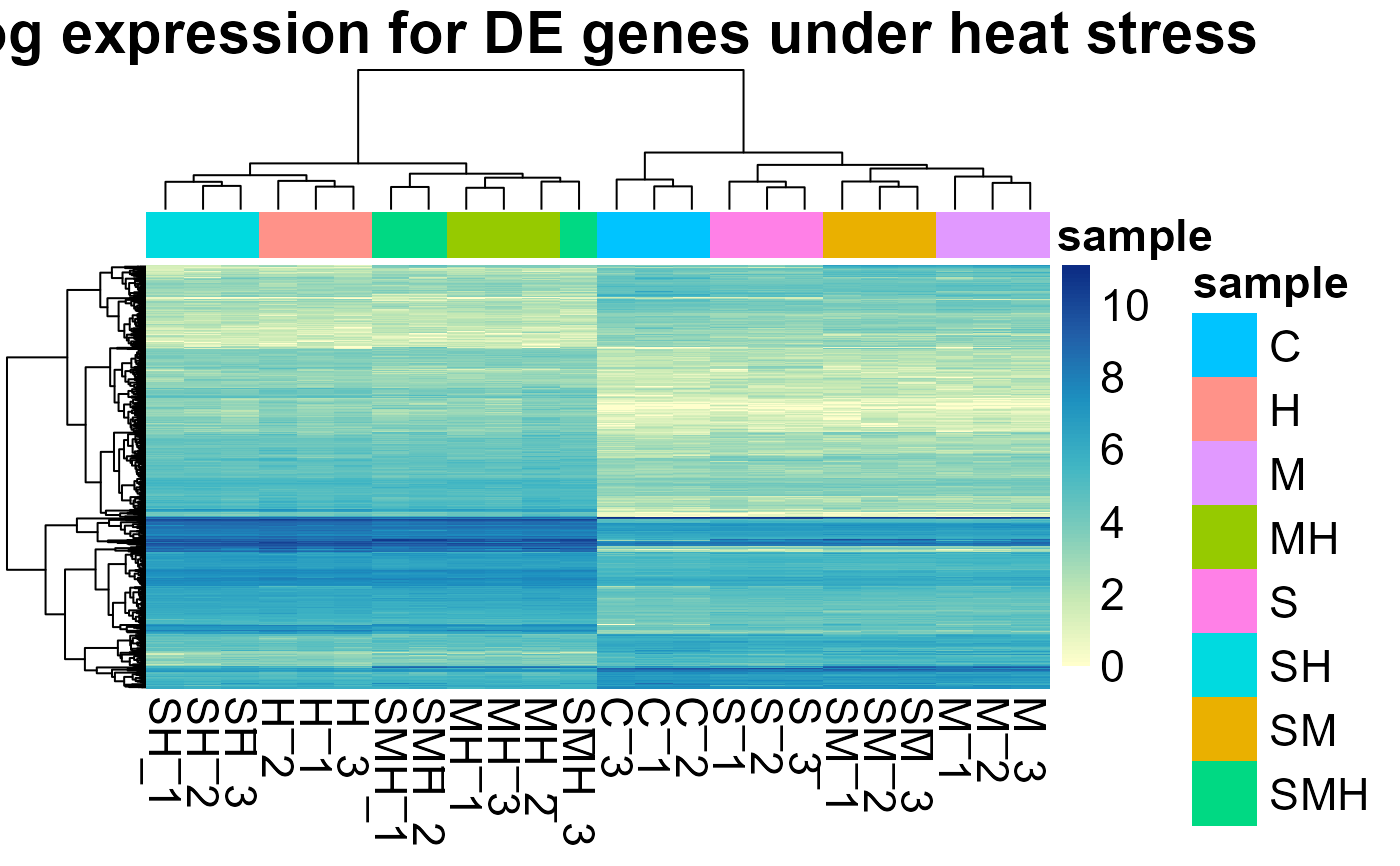
Draw expression heatmap
draw_heatmap(
  data,
  subset = NULL,
  show_rownames = FALSE,
  title = "Expression dataset",
  log = TRUE,
  profiles = FALSE,
  conditions = NULL
)
Arguments
| data | expression dataframe, with genes as rownames and samples as columns |
|---|---|
| subset | subset of genes to be display |
| show_rownames | show rownames or not |
| title | plot title |
| log | Show log(expression+1) in the heatmap if TRUE, expression if FALSE |
| profiles | Show expression/mean(expression) for each gene if TRUE, expression if FALSE |
| conditions | if NULL, shows all the conditions, else if character vector, shows only the required ones |
Examples
data("abiotic_stresses")
DIANE::draw_heatmap(abiotic_stresses$normalized_counts, subset = abiotic_stresses$heat_DEGs,
title = "Log expression for DE genes under heat stress")