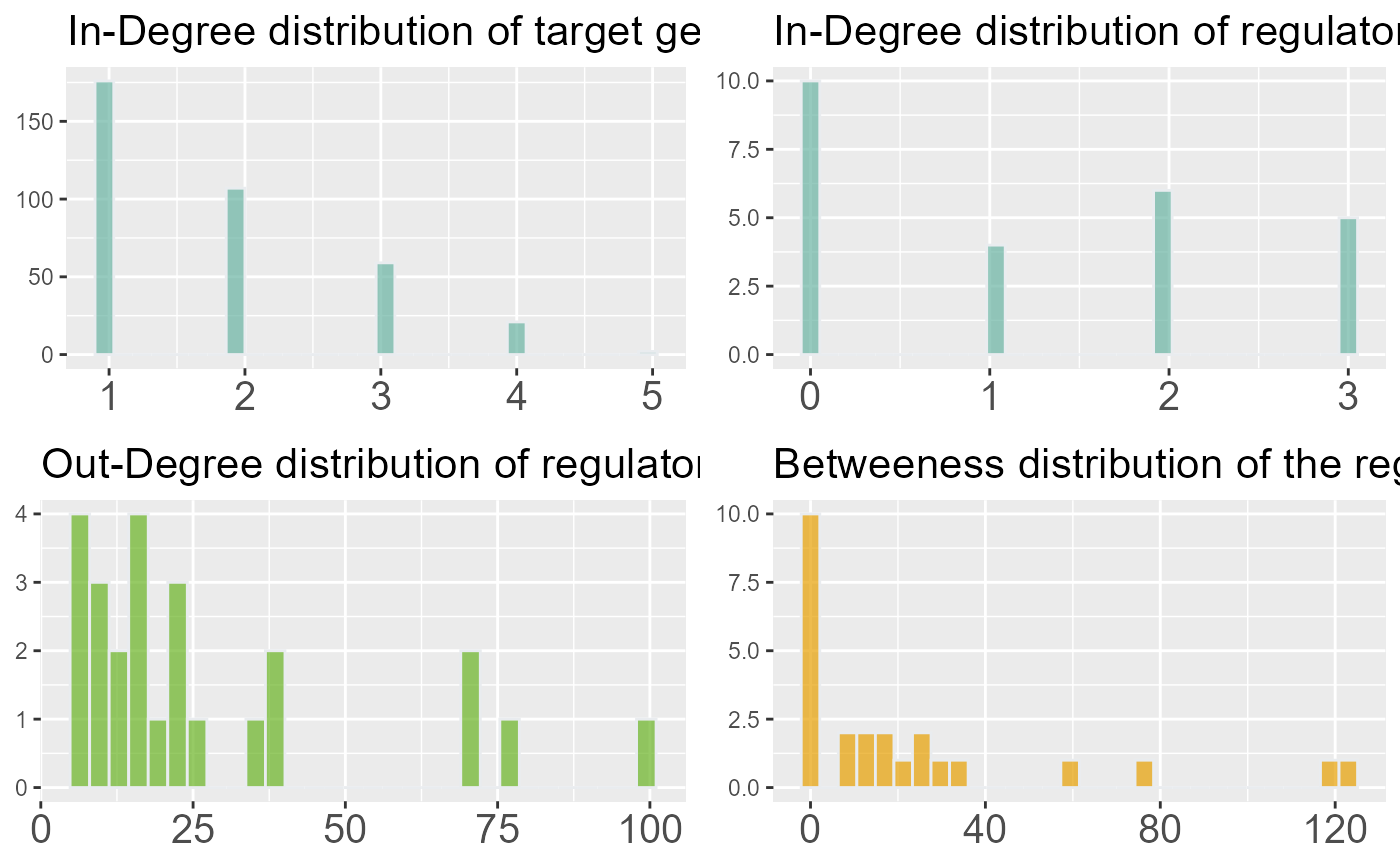
Plots the histograms of in and out degrees of regulators and target genes, with regulators betweeness.
draw_network_degrees(nodes, graph)
Arguments
| nodes | dataframe containing the nodes information |
|---|---|
| graph | igraph object |
Examples
data("abiotic_stresses") data("regulators_per_organism") mat <- abiotic_stresses$heat_DEGs_regulatory_links network <- DIANE::network_thresholding(mat, n_edges = length(abiotic_stresses$heat_DEGs)) data <- network_data(network, regulators_per_organism[["Arabidopsis thaliana"]]) DIANE::draw_network_degrees(data$nodes, network)#>#>#>#>