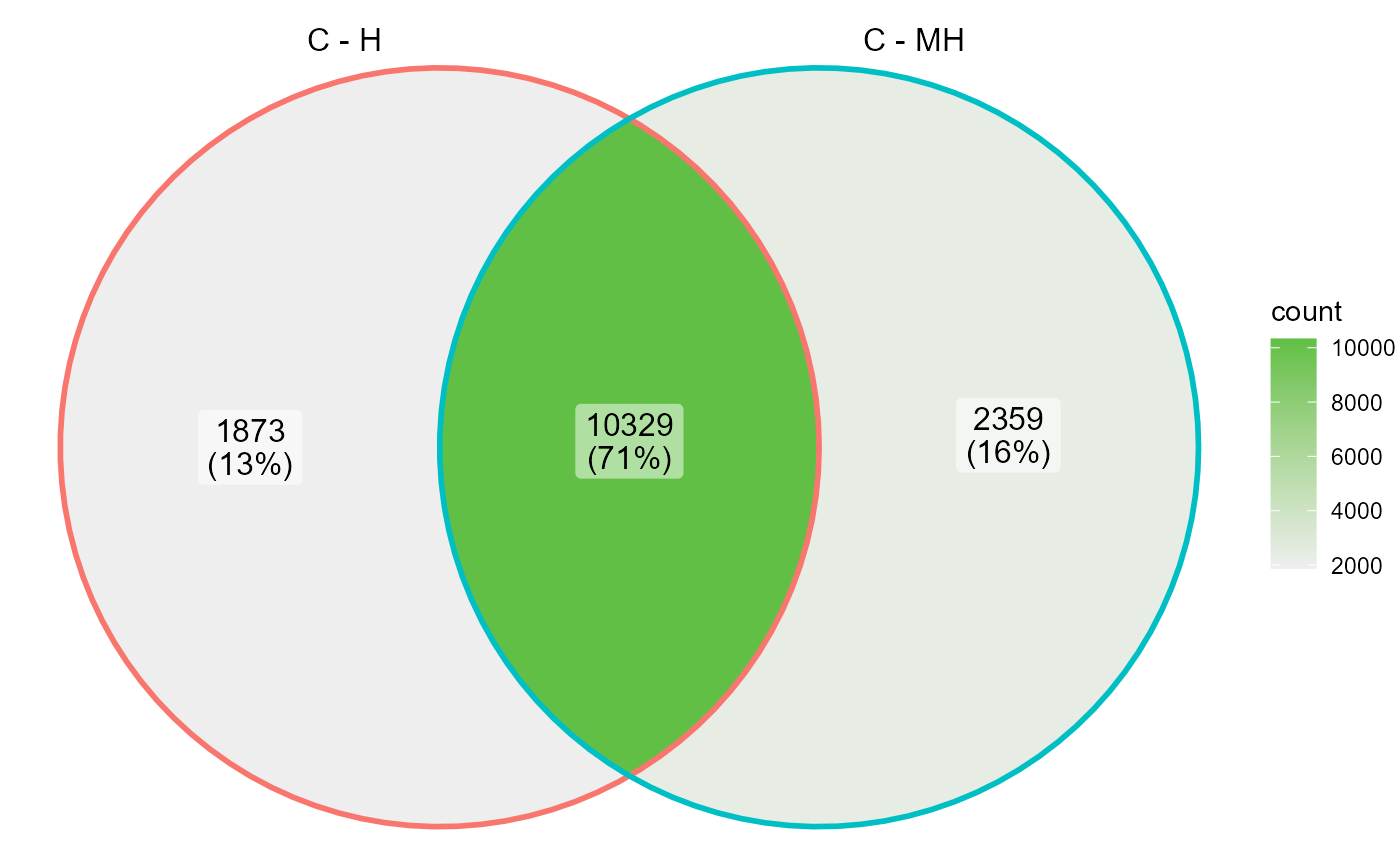
Draws a Venn diagram between lists of DEGs. Possible numbers of lists handled by the function are 2, 3 or 4.
draw_venn(gene_list)
Arguments
| gene_list | named list of genes |
|---|
Examples
data("abiotic_stresses") tcc_object <- DIANE::normalize(abiotic_stresses$raw_counts, abiotic_stresses$conditions, iteration = FALSE) tcc_object <- DIANE::filter_low_counts(tcc_object, 10*length(abiotic_stresses$conditions)) fit <- DIANE::estimateDispersion(tcc = tcc_object, conditions = abiotic_stresses$conditions)#> Warning: norm factors don't multiply to 1genes_heat <- DIANE::estimateDEGs(fit, reference = "C", perturbation = "H", p.value = 0.05)$table$genes genes_heat_mannitol <- DIANE::estimateDEGs(fit, reference = "C", perturbation = "MH", p.value = 0.05)$table$genes draw_venn(list("C - H" = genes_heat, "C - MH" = genes_heat_mannitol))